How to configure Xdebug in PhpStorm through Vagrant
This guide will explain how to configure PhpStorm to use PHP’s Xdebug extension through Vagrant. The process is not as straightforward as it should be, and available documentation has not been clear on this usage. It will be significantly easier when PhpStorm 8 is released, due to its ability to define remote interpreters. When that is available, a new post will be written, with a link to it from this one.
Update Feb. 22, 2015: PhpStorm 8 was released late 2014. As indicated in the original publication, the steps to take advantage of remote interpreters will be delineated. The process only varies slightly from the original, so the steps will be included below—instead of in a new article—with a clear distinction between the original steps, which still work very well, and the new ones. Jump to the revision.
Note that as of PhpStorm 8 some of the preferences have been structured and named differently. For example, many parts of this guide mention a “Project Settings [project-name]” heading to find the “PHP” subheading; this no longer exists in PhpStorm 8. That location has been moved to “Languages & Frameworks,” and then “PHP.”
Who will benefit from reading this guide?
Anyone who has been frustrated and ultimately defeated by attempts to run a successful debugging session through Vagrant will benefit from reading this guide. It will not explain how to install Vagrant, Xdebug, or any other tool referenced. It is also assumed that the application to debug will be accessed through a browser.
How do Xdebug and PhpStorm communicate through Vagrant?
There are two communication points to be aware of when developing in Vagrant. The first (1) is the host: the host is the main operating system (OS) that Vagrant was installed on. The second (2) is the guest: the guest is the virtual OS installed by Vagrant.
Generally, the Internet works on a client-server model. Connections between Xdebug and PhpStorm are no exception. For this use case, Xdebug is the client, and PhpStorm is the server [1]. This means that Xdebug will connect to Phpstorm whenever the PHP application is accessed, for example, through a browser. However, in order for the client on the guest (Xdebug) to connect to the server on the host (PhpStorm), it must know where to send its request.
Vagrant acts as an intermediary between these two communication points.
A connection to PhpStorm can be established if Xdebug knows the IP address (IP) of the host, where PhpStorm resides. The IP of the host is usually known to the guest, so if Vagrant is configured mostly with defaults, the IP will be something like 10.0.2.2. Upon running vagrant ssh and authenticating into the guest OS, the date of the last login and the IP are displayed. The IP can also be discovered by running netstat -r from within the guest [2]; look at the Gateway value. This IP is required for the Xdebug configuration file.
Configuring the guest installation of Xdebug, and what the settings do
The location of the Xdebug configuration file depends on the guest OS. On CentOS, it is usually located at /etc/php.d/xdebug.ini if installed through PECL. Configuration settings can also be written directly in PHP’s /etc/php.ini file. However, the server may fail to start if there are duplicate entries, so be sure only one location houses them.
The Xdebug configuration settings
The configuration should, at minimum, include the settings just below. It is also important to make sure the Xdebug extension is enabled in PHP. The line for enabling it can be included directly above the configuration settings, and will look something like this: zend_extension=/usr/lib64/php/modules/xdebug.so. The path may be different, so verify where the extension is located.
[xdebug]
xdebug.idekey="debugit"
xdebug.remote_host=10.0.2.2
xdebug.remote_port=10000
xdebug.remote_enable=1
xdebug.remote_autostart=0
xdebug.remote_handler="dbgp"
The meaning and purpose of these Xdebug configuration settings
xdebug.idekey type: string
The value can be any valid string. This is the string that will notify the browser, and thus Xdebug, that a debugging session should begin. The browser is notified by either having a cookie set (PHP COOKIE), an argument passed as a string in the URL (PHP GET), or an argument posted to the application (PHP POST); the key name is always XDEBUG_SESSION, and for this guide the IDE key (idekey) value is debugit. When a debug session is triggered, that idekey is read by Xdebug, which is listening to all incoming requests to the server hosting the application, and if it is valid, that in turn will cause Xdebug to send a request to the host server, being PhpStorm.
xdebug.remote_host type: string, default: localhost
This setting can trump people first trying to run a debug session through Vagrant. Prior to Vagrant and other virtual development environments, a default of localhost would be sufficient: the IDE, the Web server, PHP, and Xdebug, would all be running on the same machine, in the same OS. That would mean that the localhost for each tool would be the same. Vagrant changes that. The localhost for the guest OS is different from the localhost for the host OS. Their resources are virtually divorced, to put it one way. To establish that connection again, the IP of the host must be set as the value. This guide has determined that the likely IP of the host is 10.0.2.2, but be sure to verify this using the techniques described earlier.
xdebug.remote_port type: integer, default: 9000
This is the port that the server on the host OS—meaning PhpStorm—will listen to for incoming connections from Xdebug. It should be noted that the default is port 9000, but the guide uses 10000. If development takes place exclusively within the virtual machine, then it is okay to maintain that default. However, if there was no virtual layer, that port would conflict with another popular tool also listening on that port, namely, PHP-FPM, which would eliminate the likelihood of having a successful debug session.
In a typical LAMP stack setup, Apache takes care of running PHP using the mod_php extension. In more advanced setups, Apache and PHP run as separate daemons; one such setup involves a tool called PHP-FPM, which takes care of parsing and running all PHP scripts, and it listens to requests sent to it from Apache on port 9000. If the environment is hosted using Nginx, in a setup referred to as a LEMP stack, this is almost exclusively the default. This would mean that if Vagrant was not being used, the PHP-FPM daemon and PhpStorm—both running in the same OS—would each listen for connections on port 9000, resulting in a conflict.
Fortunately, Vagrant introduces that virtual divorce of resources, so it is okay to use the default remote port of 9000 for Xdebug. Though, for reasons of clarity, and if by chance the host OS has the lingering vestige of a forgotten or neglected development environment, this guide uses port 10000.
xdebug.remote_enable type: boolean, default: 0
Xdebug has a number of uses. Stepping through code in an IDE like PhpStorm is just one. This is why the default is 0; there is no need in sending off unnecessary requests, especially when nothing is waiting for them on the receiving end. Knowing this, and understanding the very purpose of this guide, the setting must be 1. Debugging in PhpStorm would be impossible otherwise.
xdebug.remote_autostart type: boolean, default: 0
Keeping the default of 0 permits finer control over when and how a debug session should be started. Setting this to 1 means Xdebug will attempt to connect with PhpStorm on every request. This is unnecessary. There are excellent browser tools available to start a debuggin session on demand.
xdebug.remote_handler type: string, default: dbgp
This setting can be excluded, but for backwards-compatibility and verboseness, it is probably best to include it. Following the release of Xdebug 2.1, dbgp is the only option. Moving forward, it is okay to ignore defining the setting, but should the version of Xdebug be unknown or old, this setting should be defined as dbgp. An explanation of the DBGp protocol is available as part of Xdebug’s documentation.
A complete list of the Xdebug configuration settings are available on the Xdebug Web site. It is beneficial to skim through the settings to become more familiar with the tool. Further settings could also be added to the configuration provided just above. A good addition would be to define xdebug.remote_log.
Configuring PhpStorm to accept connections from Xdebug, and setting up the local-to-remote file path mappings
PhpStorm requires a fairly involved setup process to listen for connections from Xdebug, and map the file paths between the remote / virtual filesystem in the guest OS and the local / internal filesystem of the host OS. In fact, this alone has probably been the reason for some developers abandoning Vagrant altogether. The process is not straightforward, and the available documentation fails to cohere the necessary steps. This is where the rest of guide diverges from most guides on configuring Xdebug—and consequently where closest attention is due.
Configure the PHP Debug settings
This step is not complicated. It must be made sure that the Xdebug port defined in PhpStorm matches the one defined in the guest OS’ Xdebug configuration, and that the ports match. The steps for this are delineated below, followed by a screenshot of the UI where these steps take place.
-
Open PhpStorm’s preferences and find the “Project Settings [project-name]” heading.
-
Expand the “PHP” setting and click on “Debug.” On the right are options pertaining to this setting. The relevant section is entitled “Xdebug.” The other ones will be ignored.
-
Ensure that the “Debug port” is
10000, as already discussed in this guide. -
Ensure that the checkbox with the text, “Can accept external connections,” is checked. The other two checkbox options are checked by default. They are good defaults, so it is good to keep them as they are.
-
Save the changes.
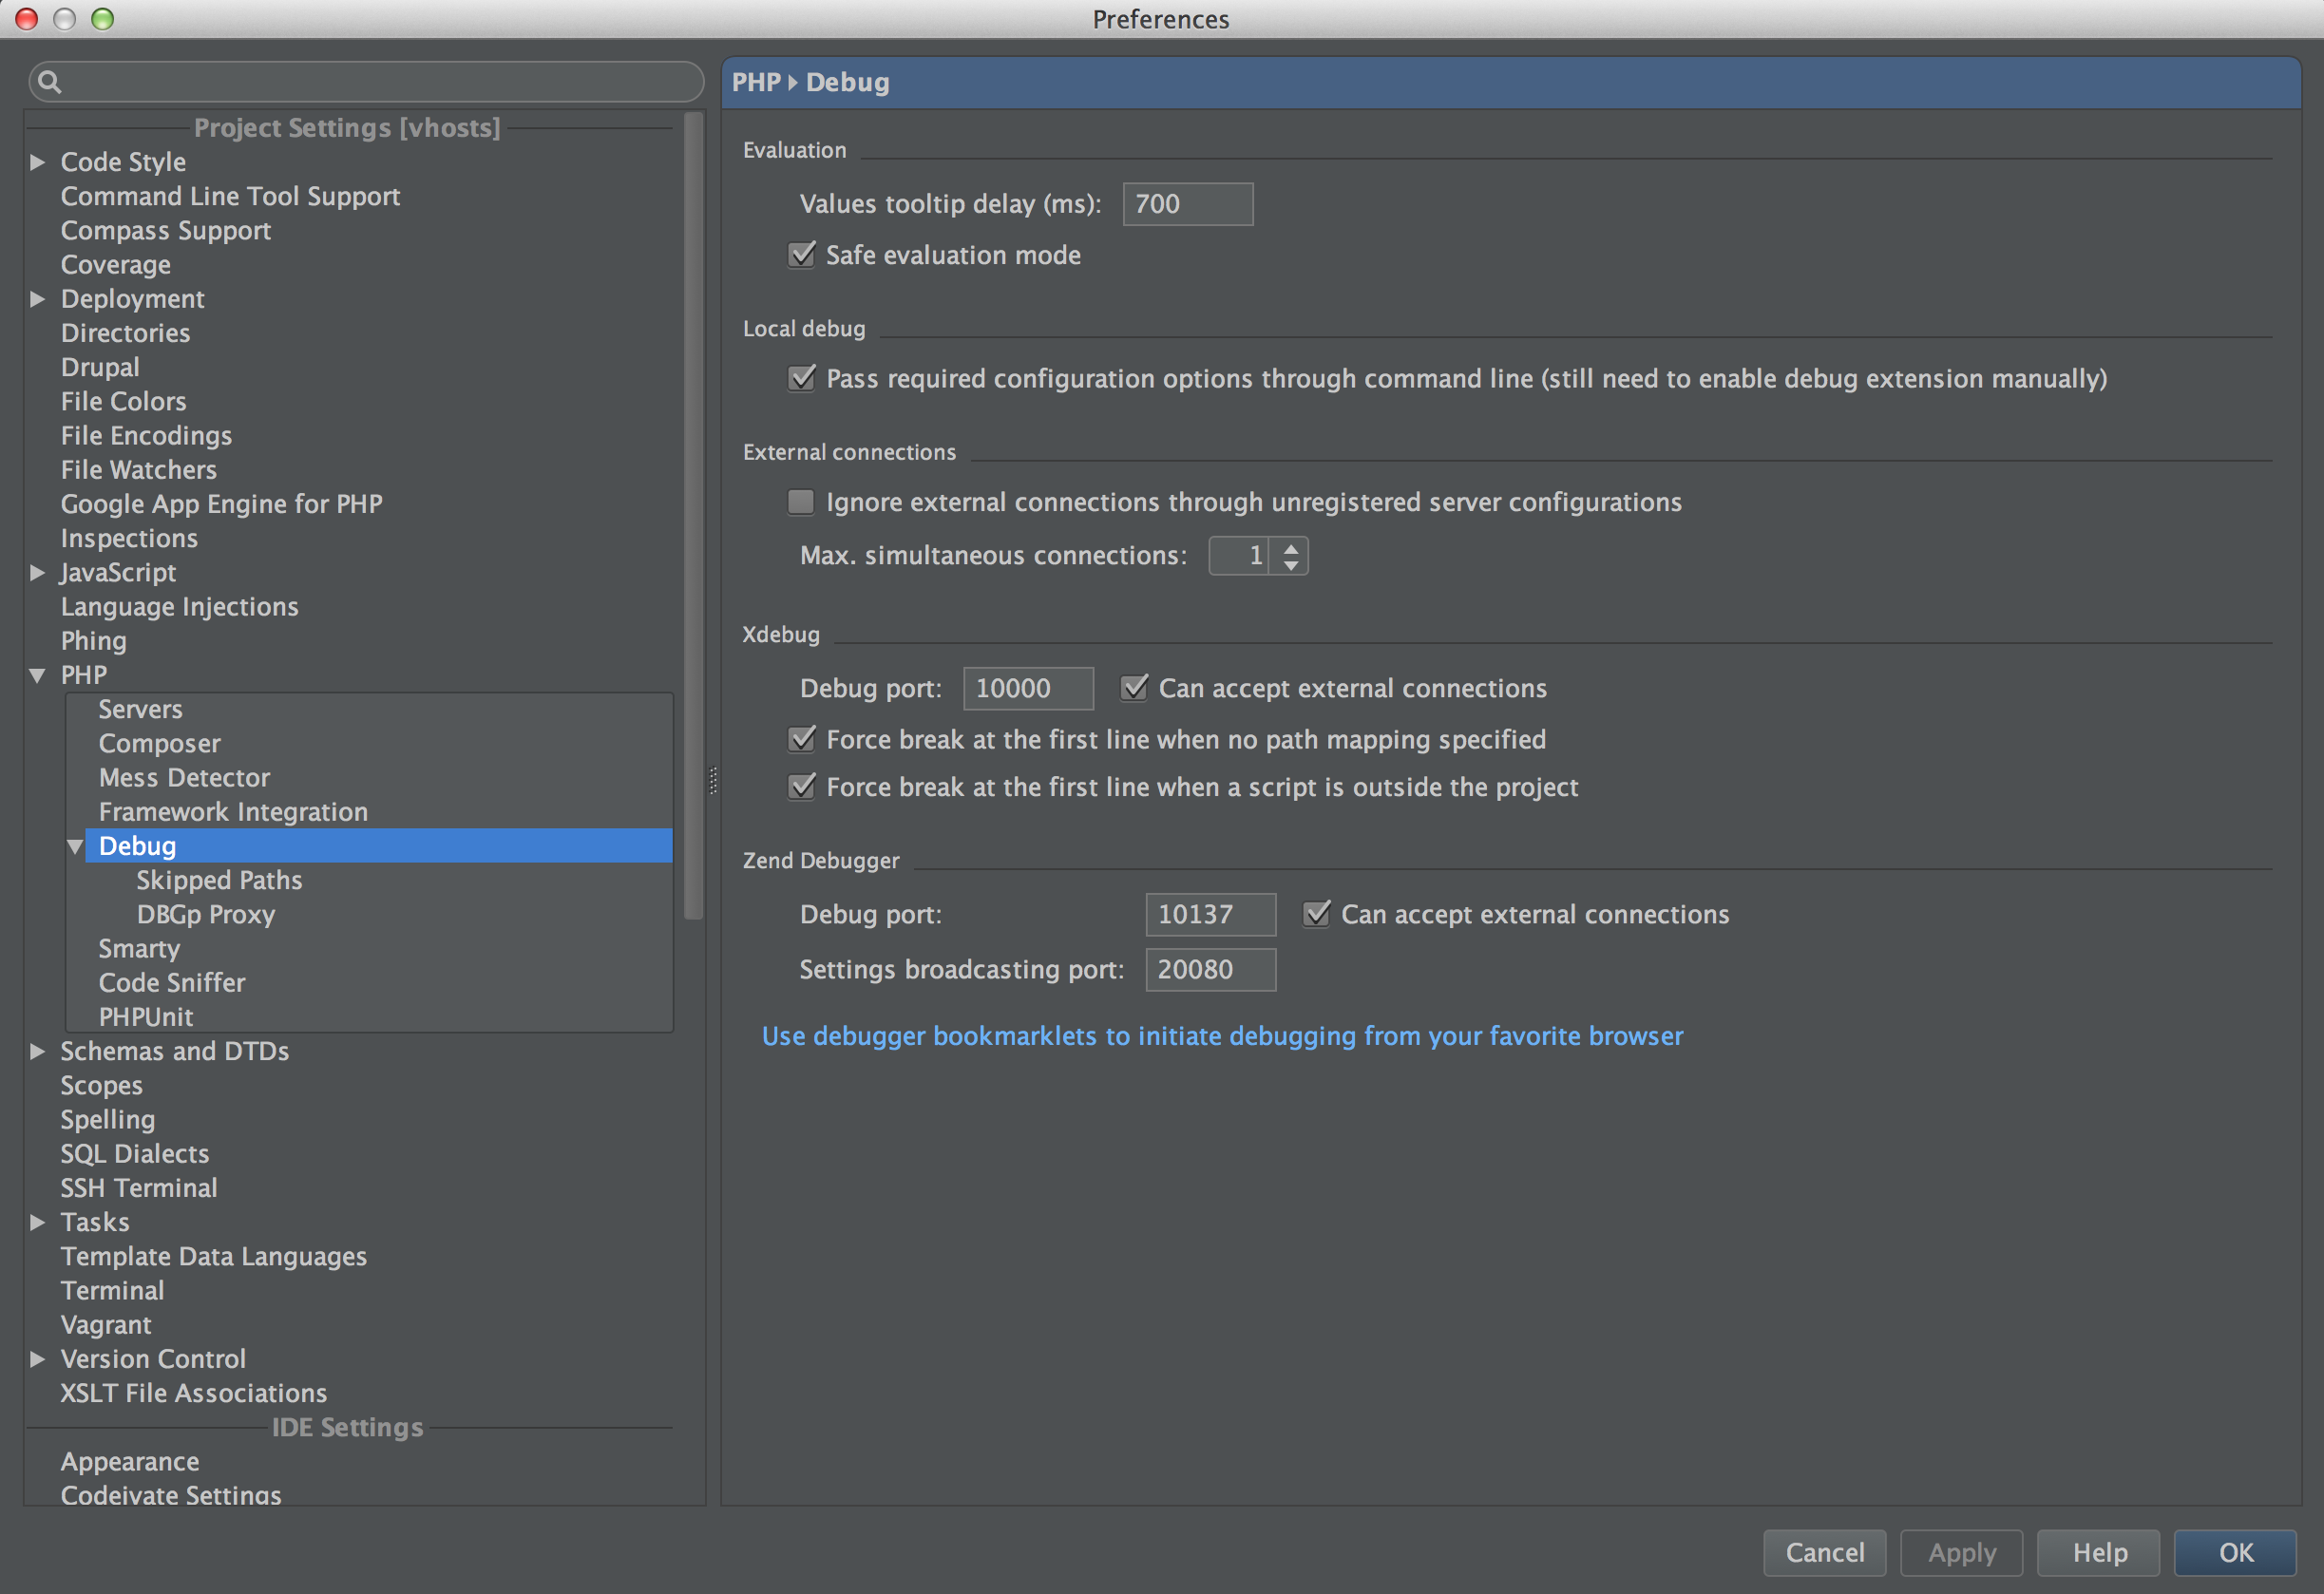
The screenshot lists two additional suboptions, namely, “Skipped Paths,” and “DBGp Proxy.” They can be ignored. The latter may seem like it could be needed, as it provides an “IDE key,” “Host,” and “Port” option as well—and in all likeliness appears to correspond with settings already configured—but it is not. This is for setting up a proxy on a remote server that will accept simultaneous connections from multiple developers. In order to do that, a script is installed on the remote server that listens for these connections, and delegates each debug session based on the incoming IDE key.
Add a remote server to the current project’s settings (and optionally define a remote interpreter in version 8)
In order for PhpStorm to make sense of what Vagrant is, and how connections between it and Xdebug are established, it needs to be told. In PhpStorm’s case, Vagrant should be regarded just like any other remote server. It would not matter if the server was across the globe, or operating in a virtual machine on the same computer. Vagrant is a remote server. That means it needs to be defined as such for PhpStorm to allow communications with it. The steps for this are delineated below, followed by a screenshot of the UI where these steps take place.
-
Open PhpStorm’s preferences and find the “Project Settings [project-name]” heading.
-
Expand the “PHP” setting and click on “Servers.” On the right are options pertaining to this setting.
-
Add a new server by clicking on the “+” symbol.
Update: As of PhpStorm 8, a remote PHP interpreter can be defined. This makes the next step (4) different depending on the version of PhpStorm in use. While the original step continues to work perfectly fine with version 8, this guide will also provide the step for taking advantage of PhpStorm 8’s remote interpreters feature. The main benefit of defining a remote interpreter is that PhpStorm will not need to have paths manually mapped, which can become very cumbersome when dealing with large projects, or when PHP hits code outside of the main project.
-
Provide the server a “Name” (this is just for easy reference, so call it anything), the actual “Host” address (this will be
localhost,127.0.0.1, or any other valid host name defined in the host OS’ hosts file), the “Port” of the Web server (most likely80, or8080, or wherever else the guest OS’ port has been forwarded to on the host), a “Debugger” of Xdebug. -
PhpStorm version
7.xand below: If PhpStorm 8 and above is installed, skip this step and continue reading from step 6 below. Finally—one of the most important steps in this guide—check the checkbox that states “Use path mappings (select if the server is remote or symlinks are used).” Due to Vagrant’s status as a remote server, there is no possible way for PhpStorm to actually know where files on the remote server (in the guest OS) are located in that filesystem. All that is available is an exact duplicate of the files on the local / host OS filesystem. This is why setting up file path mappings are essential to debugging through Vagrant.-
Just below the checkbox option, in the left column, entitled, “File/Directory,” there is a list of all the files in the current project. These are the local files. Select the project to debug. Now, in the right column, entitled, “Absolute path on the server,” provide the corresponding path to the location of that directory in the guest OS; this is typically located in
/vagrant/path/to/project-name. That path, to make an example, assumes the path on the host OS is something like/var/www/project-name. Note that the actual project name directory in the guest OS filesystem should exactly correspond with the project name directory in the host OS filesystem. Their contents should be an exact mirror of each other. This step provides the missing link between the remote and local filesystem. -
Save the changes.
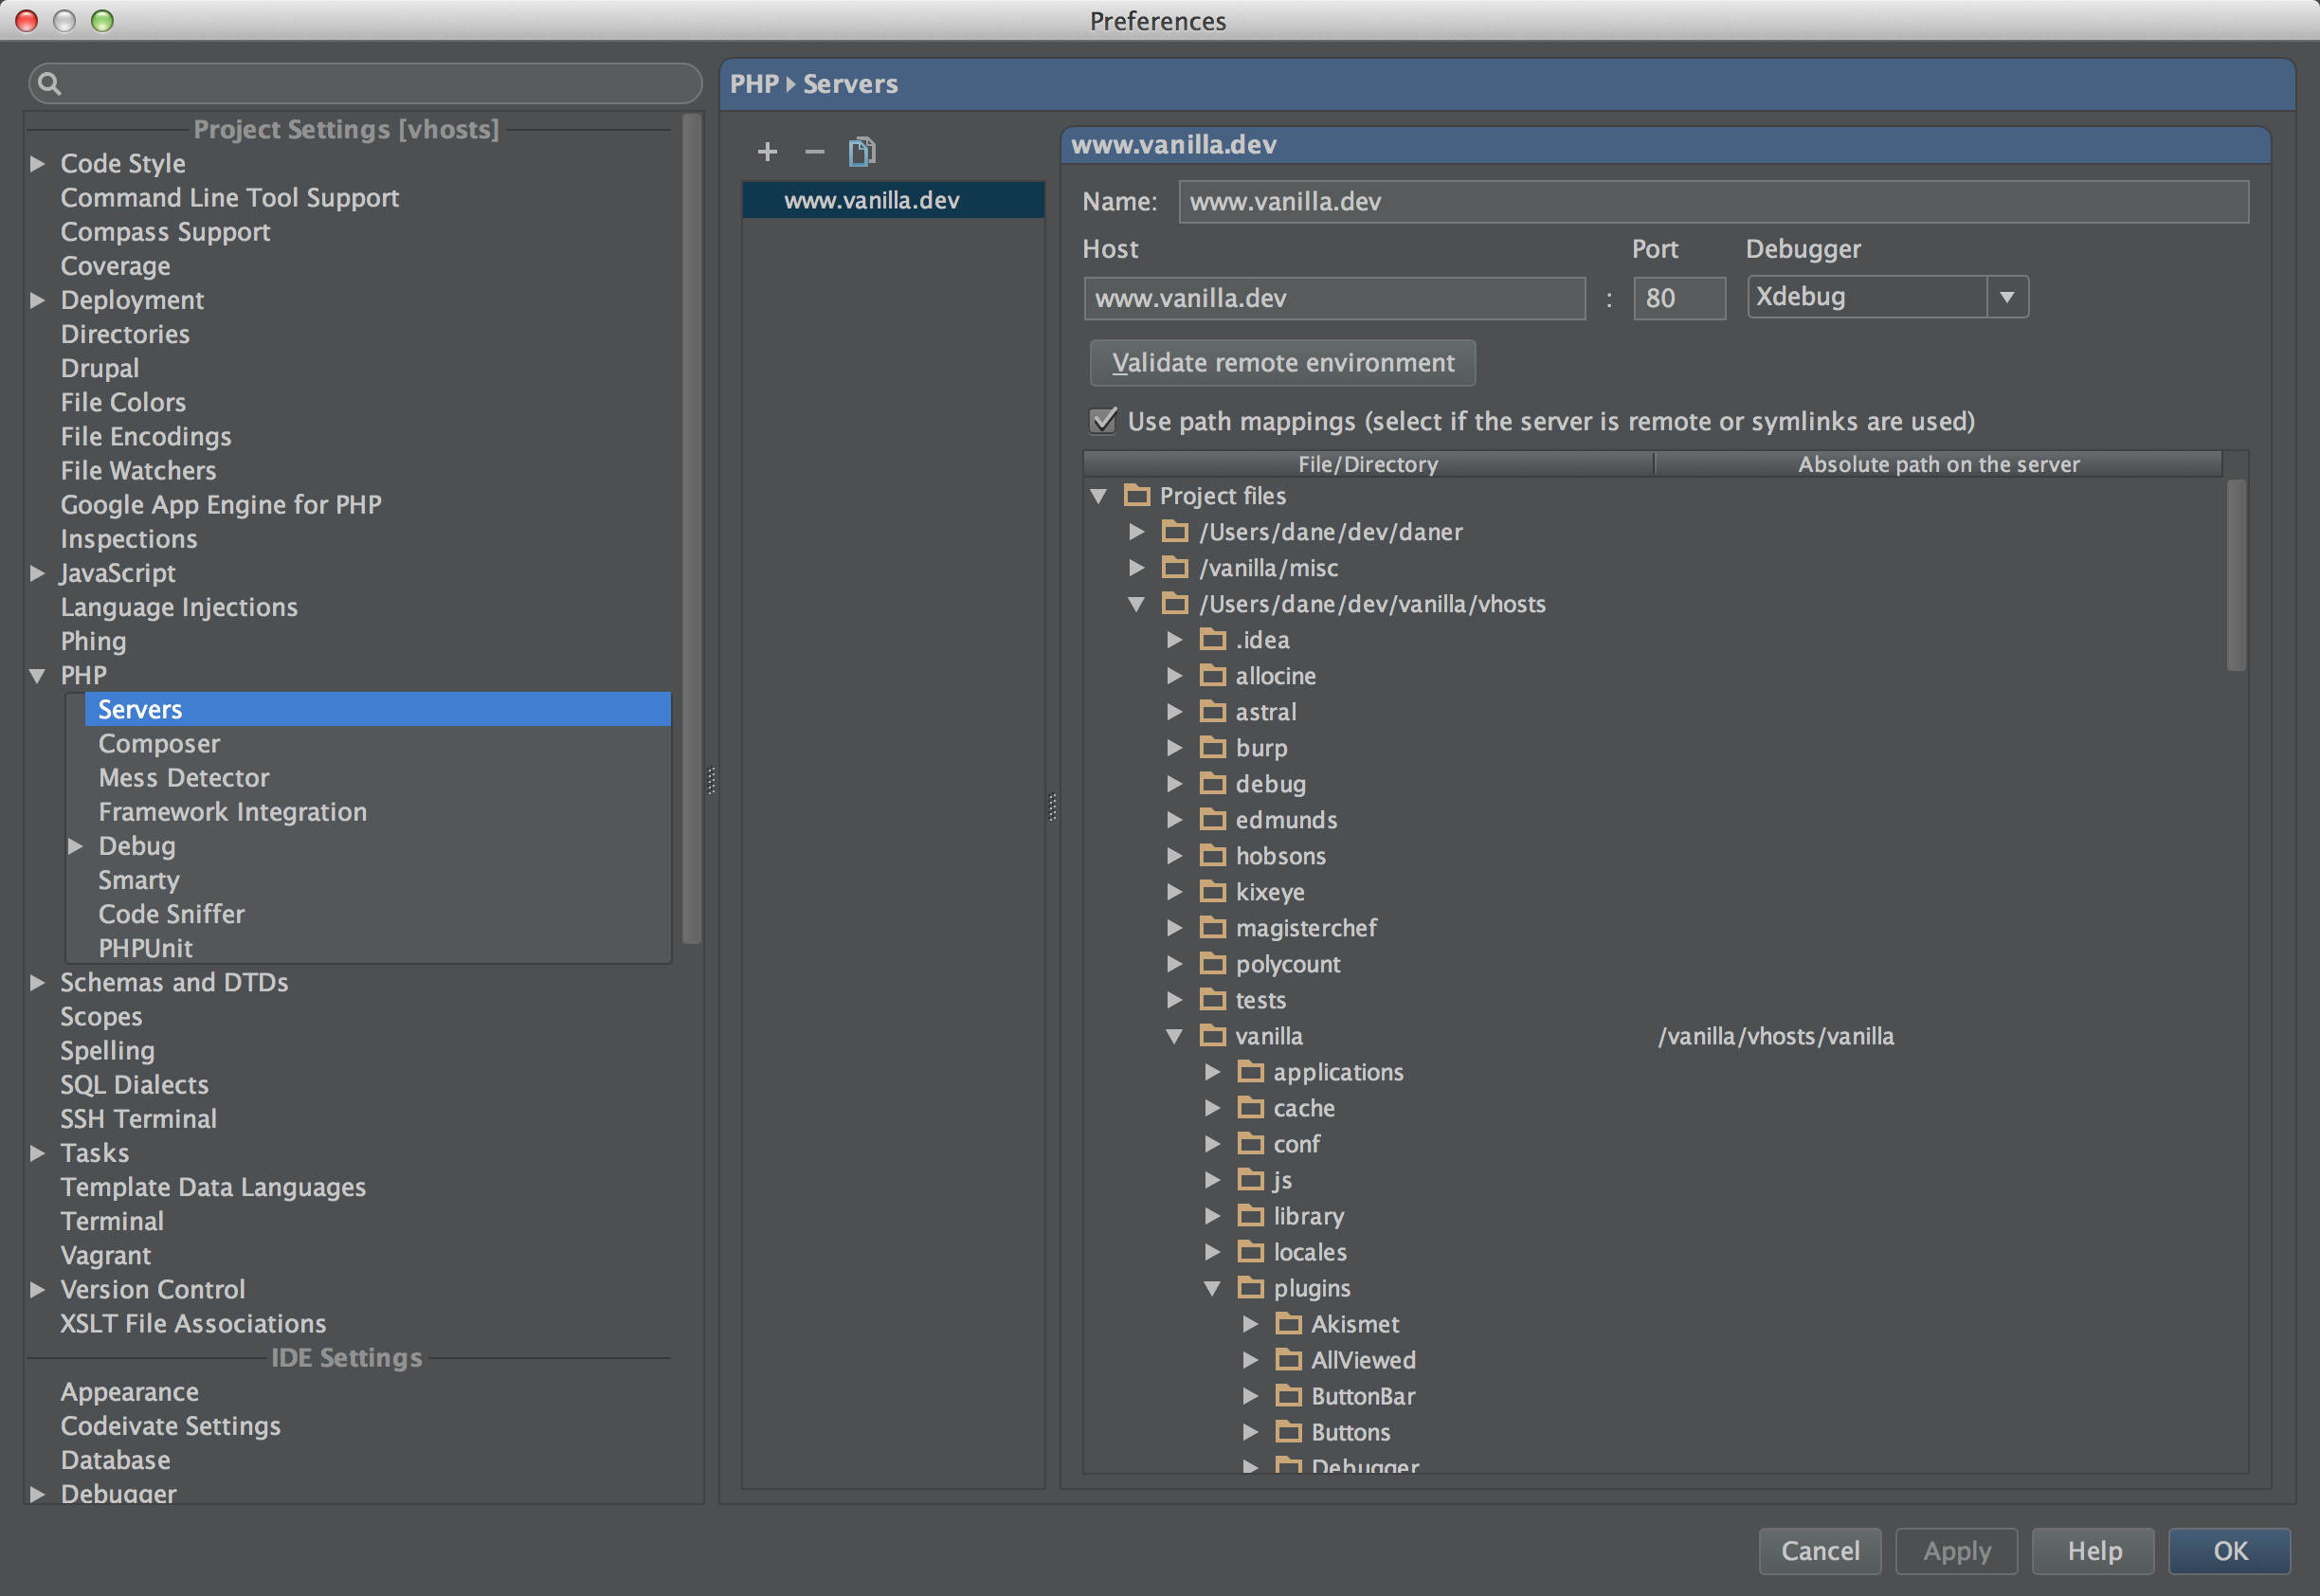
Notes about the screenshot: to elucidate any possible confusion from the values defined in the screenshot, some of them will be explained.
-
The directory of the project on the host OS is
/Users/dane/dev/vanilla/vhosts/vanillaand the corresponding path in the guest OS—in Vagrant—is/vanilla/vhosts/vanilla. That is because Vagrant’sVagrantfileconfiguration file was configured to mount an additional directory in the guest filesystem, named,/vanilla. The/vagrantdirectory also exists, though. Most default setups will just use/vagrant. -
In addition, the “Host” provided is
www.vanilla.dev, but it could have also just beenlocalhost. The host OS’/etc/hostsfile contains a custom entry, which allows custom domains like that.
-
-
PhpStorm version
8.xand above: Unlike in version 7.x and under, leave the option, “Use path mappings (select if the server is remote or symlinks are used),” alone. Leave it unchecked. Version 8 can define a remote PHP interpreter.-
Open PhpStorm’s preferences and find the “Languages & Frameworks” heading.
-
Click the “PHP” setting. On the right are options pertaining to it.
-
The “Interpreter” setting has a small ellipsis (“…”) button. Click that to open a new window of options.
-
Add a new remote PHP interpreter by clicking the “+” symbol.
-
Select “Vagrant” and provide the path to the Vagrant instance installation on the host OS; this is the directory where the
VagrantFileexists, and where commands likevagrant upandvagrant sshare run from the terminal. -
Provide a path for the “PHP interpreter path” setting. It is typically located at
/usr/bin/php, but if PhpStorm is having issues locating the binary, SSH into the guest OS (vagrant sshfrom the instance directory), and runwhich php; copy the resulting path into the designated section in PhpStorm. -
Save the changes.
-
By this point PhpStorm should have automatically tested the connection and reported the version of the remote PHP interpreter in the guest OS. It will have also named the remote interpreter.
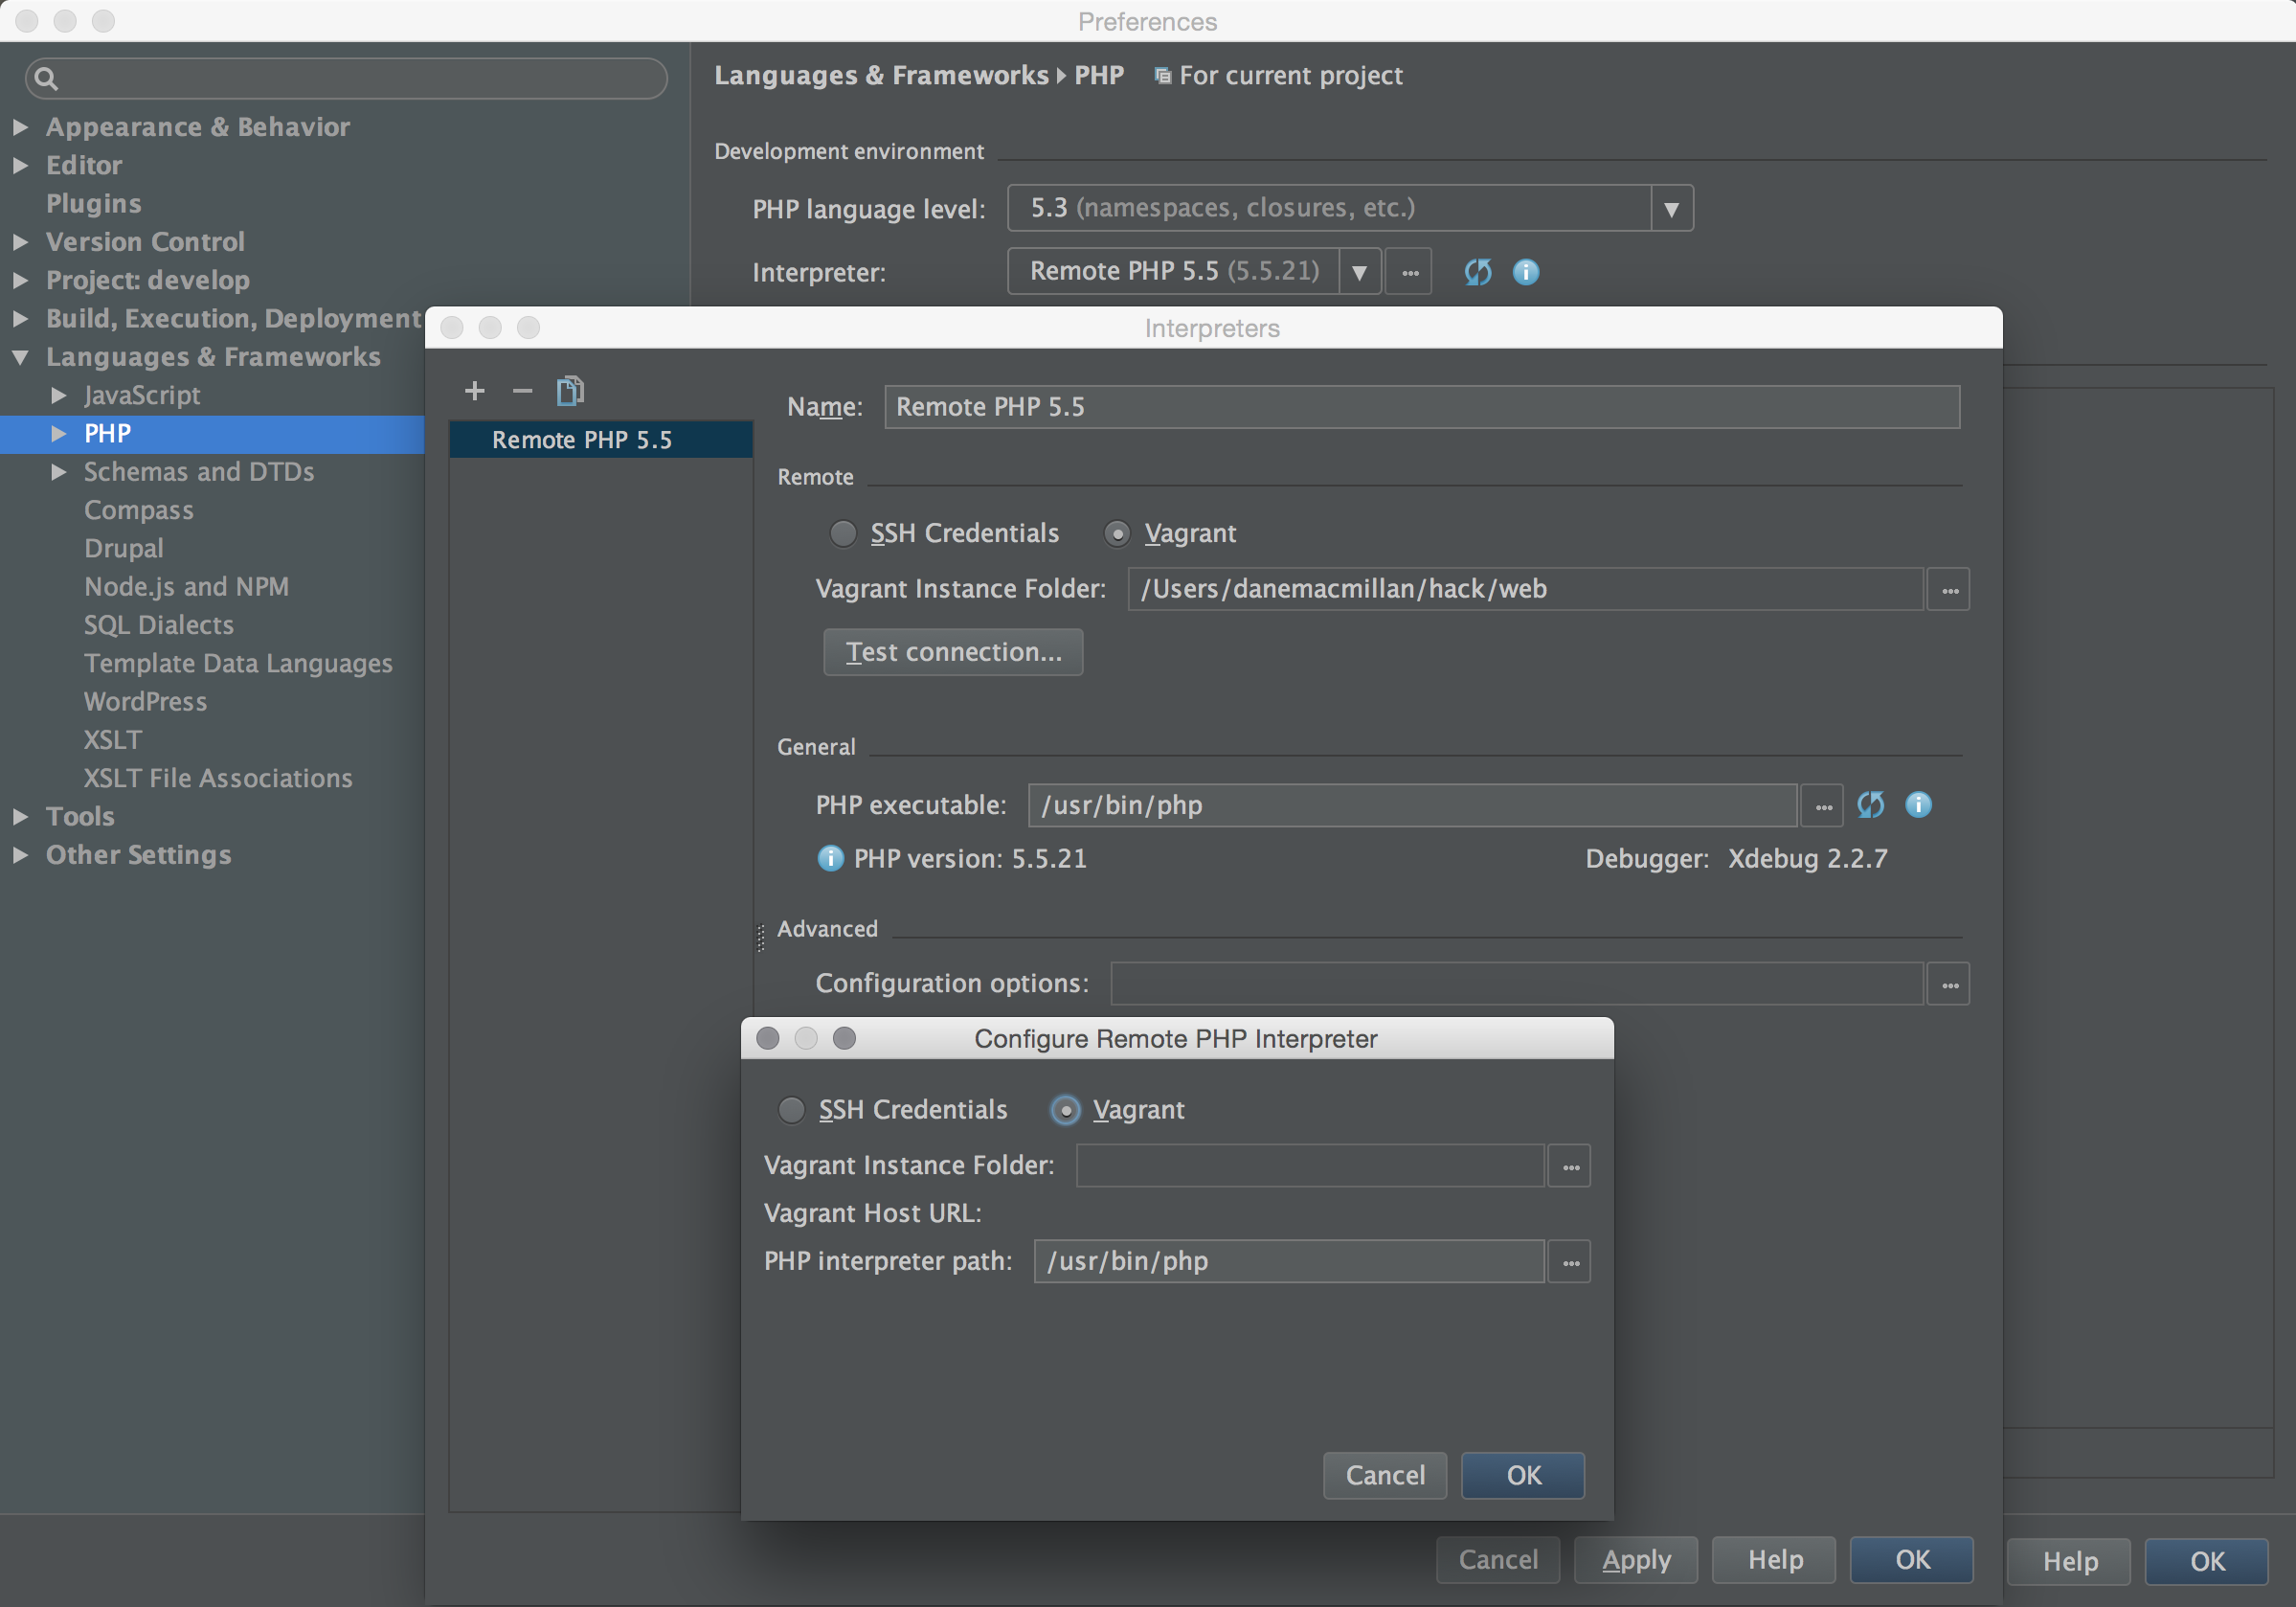
Notes about the screenshot: There are two windows layered on top of the main preferences window. The foremost one is triggered by clicking the “+” symbol in the middle layer window. That middle layer window is triggered by clicking the “…” button next to the “Interpreter” setting.
-
The most essential component to debugging PHP applications hosted in a Vagrant box using PhpStorm is now complete.
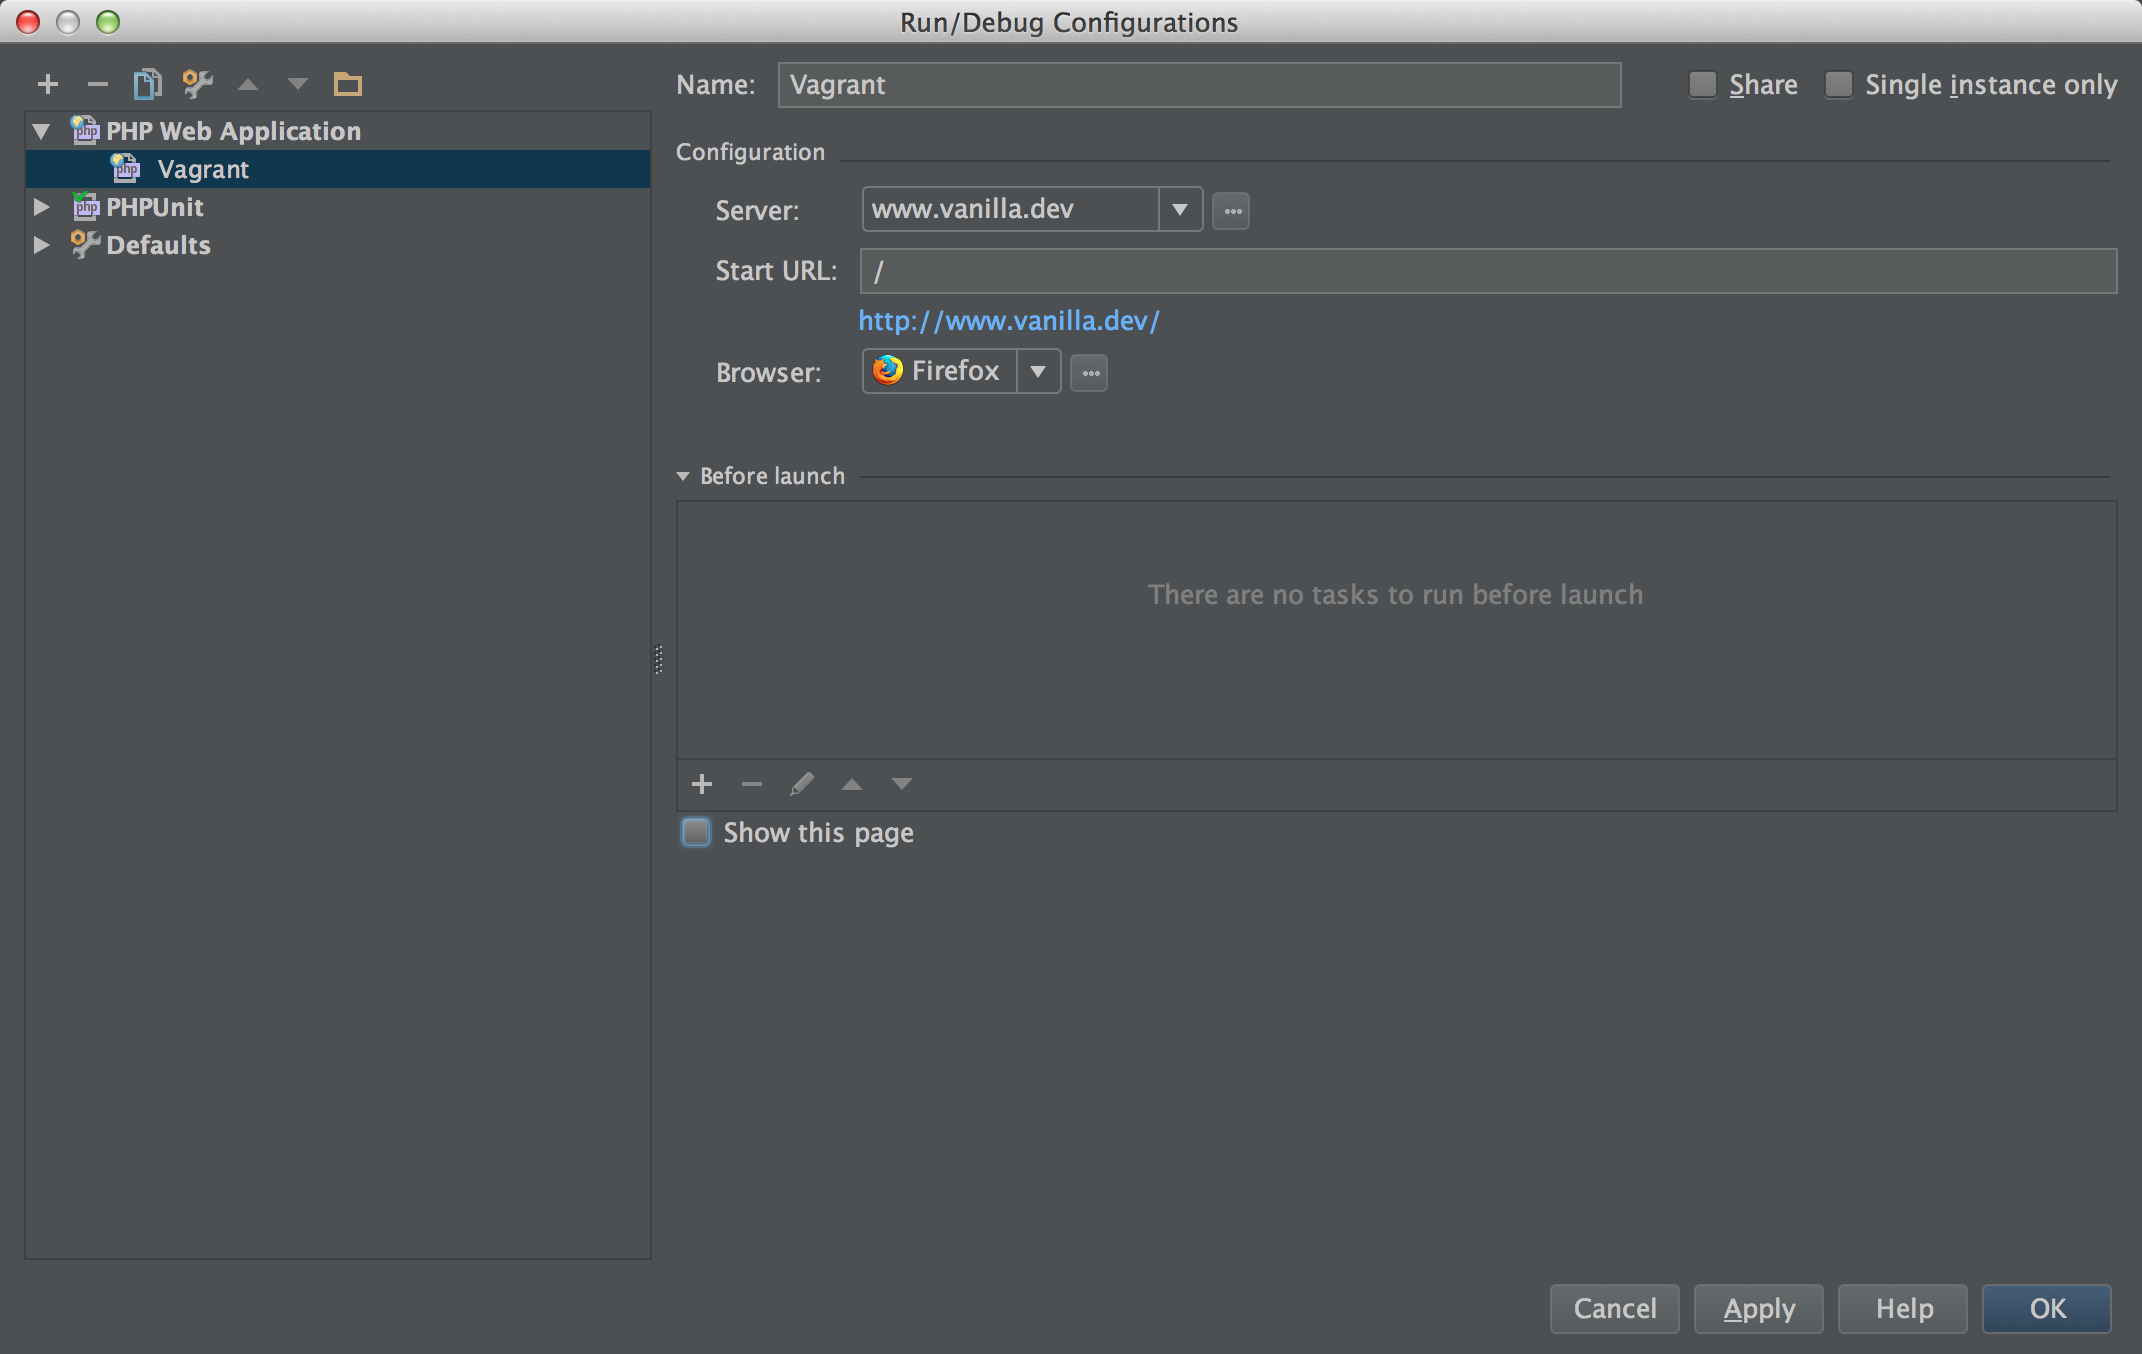
Create PhpStorm’s debug configuration
This is the last section to follow in order to run a successful debugging session. The Xdebug configuration settings have been defined in the guest OS; PhpStorm on the host OS has been configured to use the right port and allow external connections; the local-to-remote file path mappings have been set up so the IDE knows exactly how to step through any line of code. All that remains is setting up the “Run/Debug Configurations,” and starting the service listener so PhpStorm can actually debug code. The previous steps in this guideline must be completed prior to the next and final section.
The steps for creating the debug configuration are delineated below, followed by a screenshot of the UI where these steps take place.
-
Click on the “Run” toolbar menu option at the top of PhpStorm.
-
The dropdown of options all pertain to debugging code. Click on “Edit Configurations.” A window appears with the relevant settings.
-
The left column lists different types of run and debug configurations. They are kind of like different tool definitions that PhpStorm can implement to analyze code more effectively. Add a new configuration by clicking on the “+” symbol, and select “PHP Web Application.” An “unnamed” tool definition is created. The right column displays its configuration interface.
-
Provide the configuration a “Name.” This can be anything, but for clarity, this guide uses “Vagrant.”
-
The “Server” setting should have the name provided in Step 4 of ‘Add a remote server to the current project’s settings’ earlier in the guide. If it is not an available option in the dropdown, revisit that section of the guide; make sure it is configured properly.
-
The “Start URL” will depend on the application. Many MVC-type frameworks, though, will use the root of the URL, so a
/will suffice. That essentially means that the index file of the document root will be used:index.phpin most instances. -
Choose the “Browser” where most development takes place. This is to ensure that the browser will automatically switch to PhpStorm when a breakpoint is reached. Later, the browser will be configured with an addon that simplifies debugging.
-
Save the changes.
Listen for incoming debug connections to PhpStorm from Xdebug
At the top right of PhpStorm should be a toolbar similar to the images provided. With the project open, select “Vagrant” from the dropdown. Remember that this was just defined. It is the “PHP Web Application.” A few buttons over there is a telephone receiver icon with a bug at the mouthpiece and a banned symbol at the earpiece. Click on this. The banned symbol at the earpiece should change into a sort of abstract visualization indicating that PhpStorm is listening for connections.


PhpStorm is ready to accept connections from Xdebug. All that remains is knowing how to trigger them.
Starting a debug session
There are a few methods to start a debug session. PhpStorm provides bookmarklets for this, but they are not ideal. Do not even bother. The best option is one that integrates with a Web browser. Both Firefox and Chrome provide addons for this. It is unnecessary to install each if only one Web browser will be used.
Install an Xdebug addon for Firefox
Install The easiest Xdebug addon for Firefox. It provides only one option: define its “IDE key for remote debugging.” Remember that this guide defined the IDE key as debugit, so use that.
Install an Xdebug addon for Chrome
Install the Xdebug helper addon for Chrome. There are some additional options, but the relevant one for this guide is to define the IDE key. It provides different IDEs to select from—which provide the most common IDE key values for each IDE—as well as an “Other” option. Choose that and type in debugit as the IDE key.
Define a breakpoint in PhpStorm
PhpStorm is already listening for incoming connections, but if a breakpoint is not set, the code will execute to the end without pausing.
Open a file in the project, and click in the empty margin to the left of a line number. A tiny orb will indicate that a breakpoint has been set.
Trigger a debug session from a Web browser
Return to the browser and click on the the debug icon that it provides. That will set a browser cookie with the defined IDE key, which will be read by Xdebug where PHP is running code in the guest OS, as mentioned earlier. In turn, that commands Xdebug to send a request to PhpStorm, which is listening for a connection. Navigate to a page that will be affected by the breakpoint set in PhpStorm, or refresh the page if that has already been done; note that the page appears to hang. That means PhpStorm has paused execution of the PHP script at the designated breakpoint until the code has been stepped through or execution resumed. Return to PhpStorm and look for the file with the set breakpoint. The debuger tab should be visible, with all the variables and constants of the page ready to get populated with data. This is how it should appear:
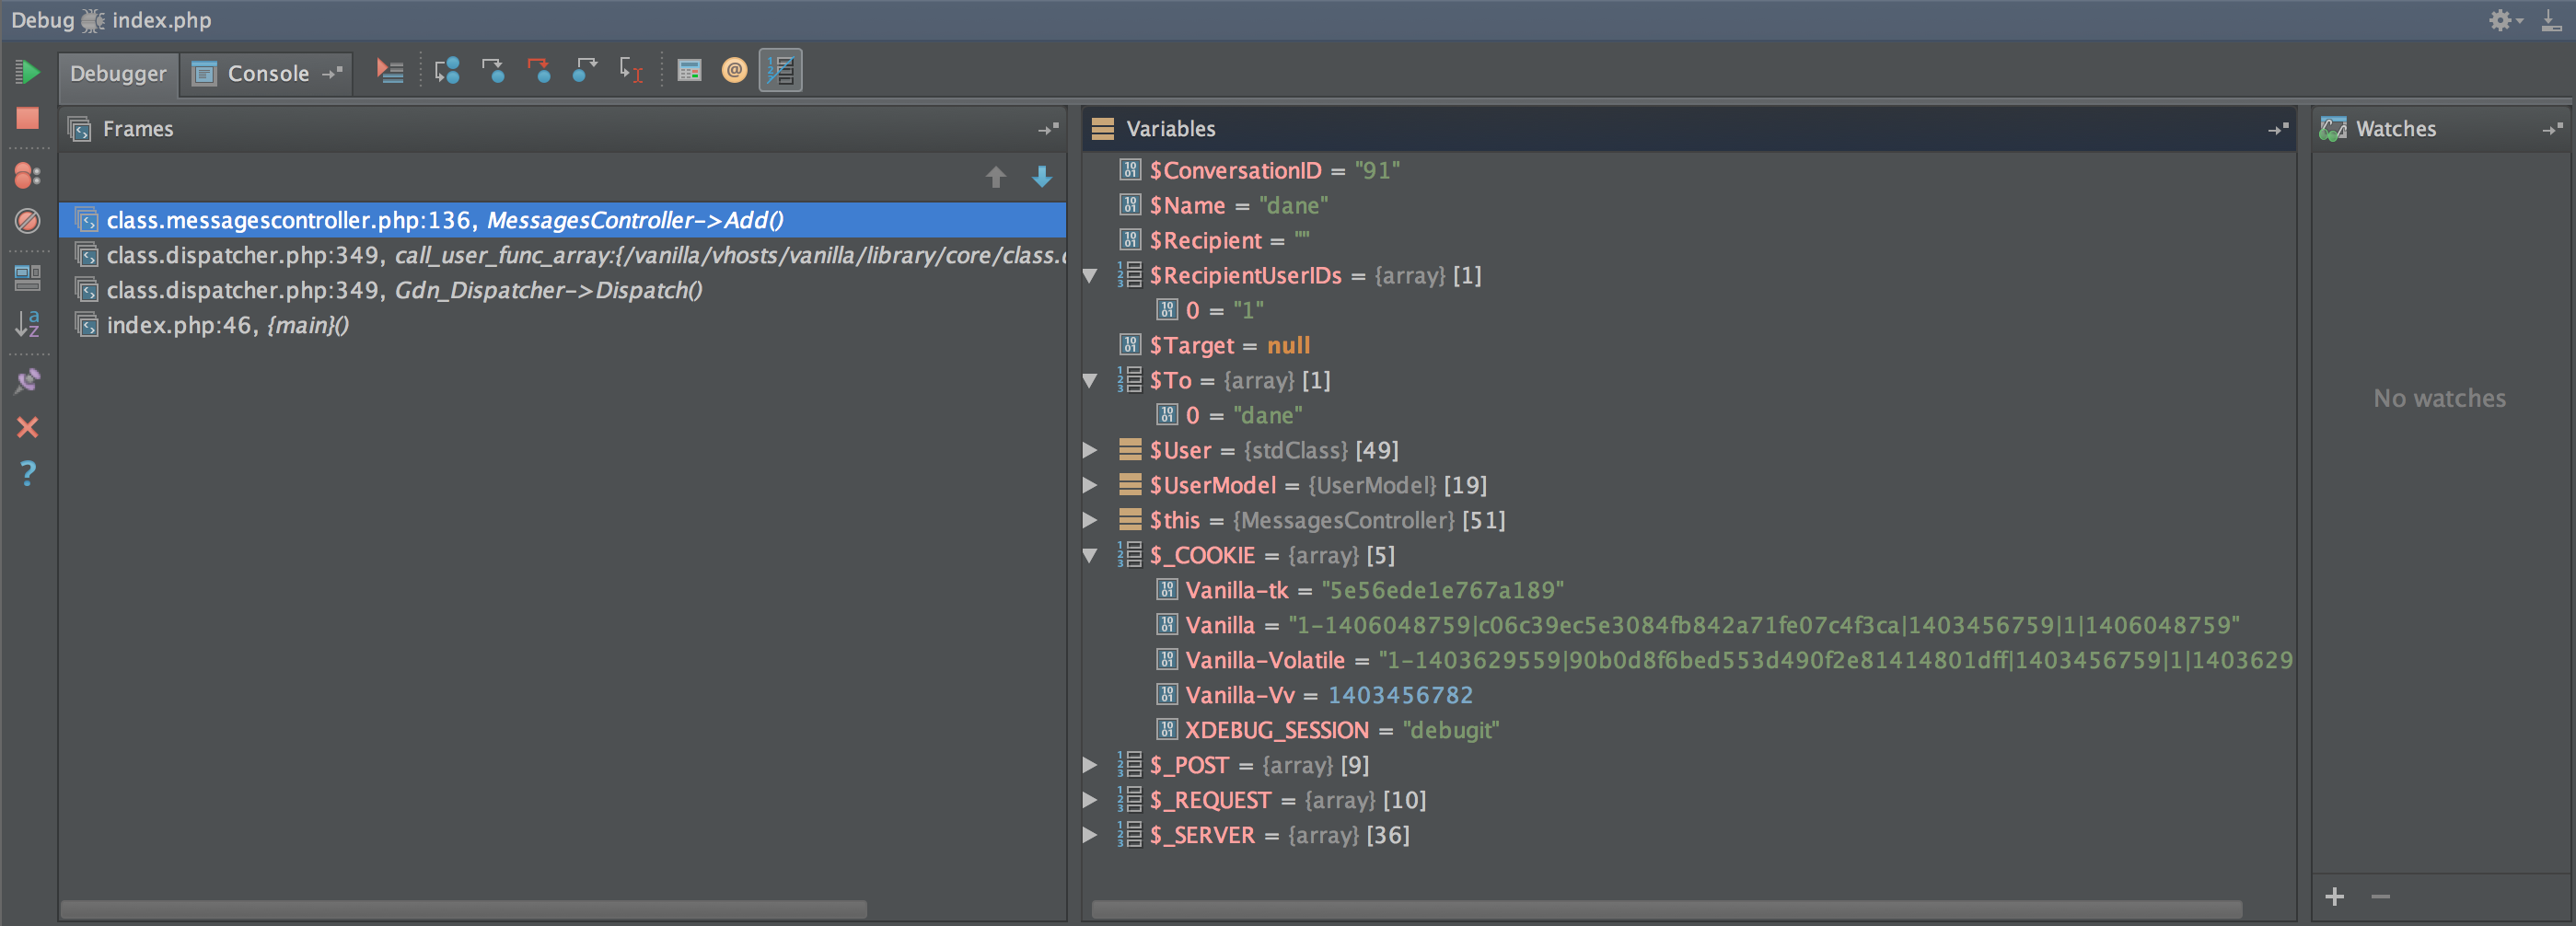
Notice the $_COOKIE superglobal includes the XDEBUG_SESSION = "debugit" cookie set by the browser.
Summary of how to configure and run PHP Xdebug in PhpStorm through Vagrant
-
Xdebug in the virtual guest OS installed by Vagrant is configured for remote debugging.
-
PhpStorm’s debug settings are configured. External connections are allowed through the designated port.
-
A remote server is added and defined for PhpStorm. This allows it to know how to communicate with the guest OS in Vagrant. Most importantly, the local-to-remote file path mappings are defined. That allows the files in the guest filesystem to map to the files in the host filesystem, where PhpStorm will step through code.
-
A new “PHP Web Application” is created. It points to the server just added.
-
Set PhpStorm to start listening for incoming debug connections.
-
Install a browser addon to easily trigger debug sessions.
-
Set a breakpoint in PhpStorm for the given project.
-
Start the debug session in the browser, refresh it, and return to PhpStorm to view the open debugger tab.
Appendix and troubleshooting
-
This guide uses CentOS 6.5 as the guest OS, and Mac OSX as the host OS. The steps should not change much or at all if the OS of either is different. For example, the process for a Windows host OS should not be very different.
-
The most common IDE key used in PhpStorm is
PHPSTORM. The guide usesdebugit. It does not matter what key is used, but it should be noted that some debugger tools, like Chrome’s “Xdebug helper” addon, does not provide a text box to define a key if PhpStorm is chosen. It automatically assumes that the key will bePHPSTORM. This is why “Other” was chosen. Another popular IDE, NetBeans, commonly defines the IDE key asnetbeans-xdebug. -
If the project contains symlinks to other code being used from other locations, PhpStorm’s debugger tab will complain about missing file path mappings. Make sure any symlinked code is properly mapped with its guest filesystem counterpart in Vagrant.
-
The assumption has not been tested, but it is very possible that the steps to configure PHPUnit to work in PhpStorm through Vagrant would be similar.
Other reference material
Feedback
Did you notice something wrong with this guide? Have you found related material on the Web somewhere? Let me know in the comments. Also, if you know someone who might want to read this, share it with them.